Trying to use the Xdebug Profiler to find bottlenecks in my script, I tried to change the [XDEBUG] section in the php.ini file to this:
xdebug.mode=profile
xdebug.output_dir="C:\MyFolder"
Unfortunately when trying to start the website within VS, I get this message:
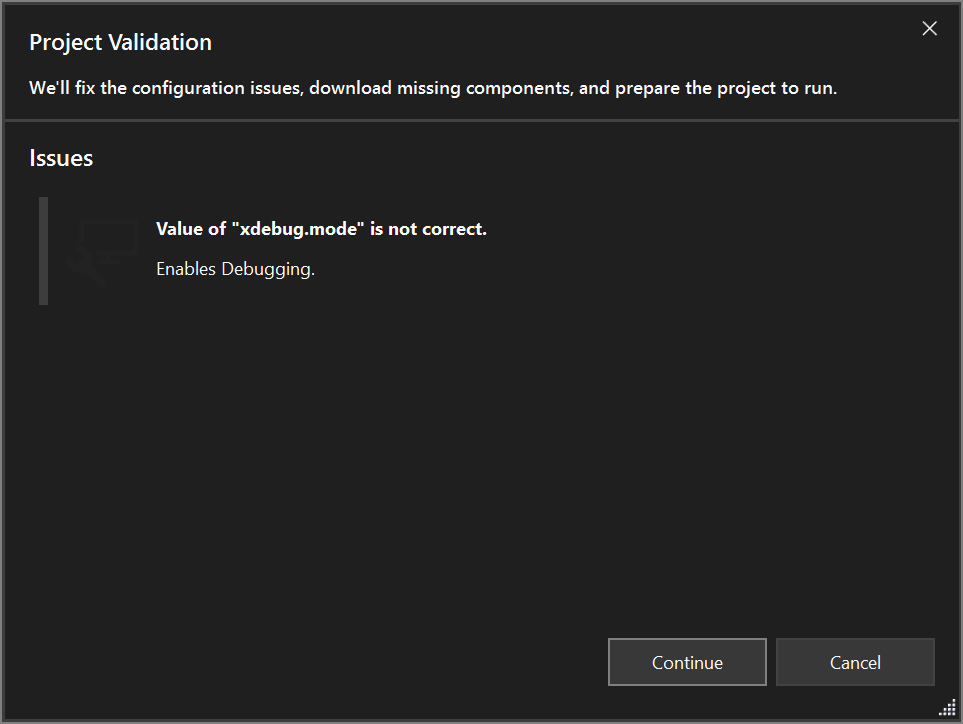
- When clicking
Continue, the value ofxdebug.modeis set back todebug. - When clicking
Cancel, the application will not be started.
My question
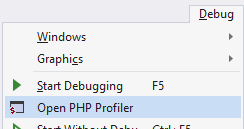
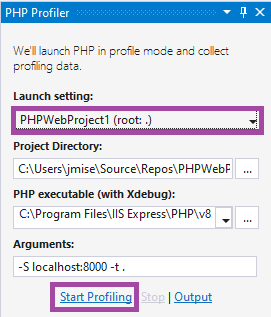
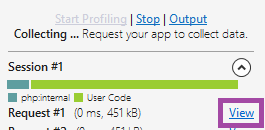
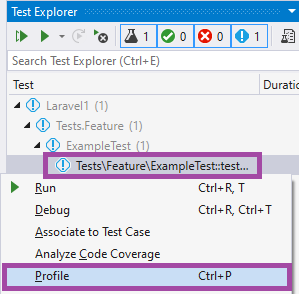
Is there any built-in support for running the Xdebug Profiler in PHP Tools?
If not, any chance to not get the above error message to be at least able to run the profiler and manually inspect the results?

